
Indoor Air Quality Sensor: Key Metrics Measured And What They May Indicate

Devices designed to monitor the composition and conditions of enclosed spaces measure airborne particles, gas concentrations, and basic environmental parameters. These instruments generally use optical, electrochemical, or sorptive detection methods to convert physical or chemical presence into electronic signals. Typical outputs include particle counts by size fraction, concentrations of carbon-containing gases, relative humidity, and temperature. Data from these monitoring systems aim to describe the state of an interior environment at a given time or over a period, supporting assessment and comparison rather than providing definitive diagnoses or health claims.
Measurement components commonly found in such monitoring equipment include laser-based counters for particulate matter, nondispersive infrared modules for carbon dioxide, metal-oxide or photoionization detectors for volatile organic compounds, and sensors for temperature and humidity. Each component has operating limits, response times, and sensitivities that vary by technology and application. Readings may be influenced by factors such as airflow, recent activities (cooking, cleaning), and sensor drift, so interpretation often requires context and, in some cases, comparison with reference measurements or log histories.
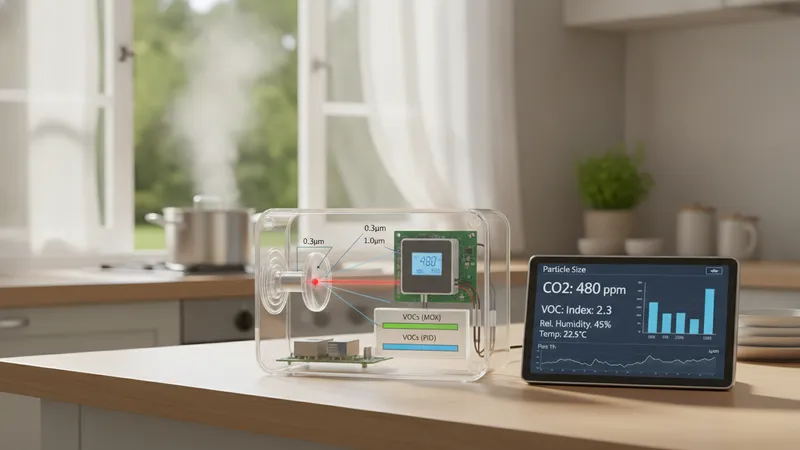
- Optical particle counters: devices that detect and size particles using light scattering; typically report PM1.0, PM2.5, and PM10 mass or counts and may be used for continuous monitoring in occupied spaces.
- NDIR carbon dioxide modules: nondispersive infrared sensors that measure CO2 in ppm and are commonly used to infer ventilation effectiveness in enclosed areas.
- PID and metal-oxide VOC detectors: instruments that detect a range of volatile organic compounds, often reporting a composite index or estimated concentration in parts per billion (ppb) to parts per million (ppm).
- Combined multi-parameter monitors: integrated units that log particles, CO2, VOCs, temperature, and humidity concurrently for simplified data correlation.
Optical particle counters and CO2 modules often serve different diagnostic roles: particle counters may indicate sources like combustion or resuspension of dust, whereas CO2 levels can reflect occupancy and ventilation. Photoionization detectors typically respond to a broad class of organic gases but may vary in sensitivity across compounds, so reported VOC indices are usually comparative rather than absolute for individual chemicals. Cross-sensitivity among gases, environmental effects like humidity, and sensor aging all affect readings. In practice, combining data streams can provide a more comprehensive picture than any single metric alone.
Calibration and verification are important considerations. Some sensors include factory calibration with documented tolerances, while others may drift and require periodic checks against a calibrated reference instrument. Calibration intervals can vary by sensor type and usage intensity; for some electrochemical cells or optical counters, annual verification may be common, while other modules could need more frequent attention. Traceability to known standards or reference devices helps maintain comparability over time, and documented calibration records support consistent interpretation when monitoring over months or years.
Placement strategies typically influence the usefulness of measurements. Sensors placed near emission sources, vents, or windows may show localized values that differ from representative room-level conditions. Mounting a unit at breathing zone height and away from direct airflow or immediate sources often yields data that are more representative of occupant exposure. For portable or short-term assessments, moving a sensor through different zones can reveal spatial variability. Users often consider multiple sampling points in larger spaces to account for heterogeneity rather than relying on a single location.
Data presentation and logging features can affect how readings are used for analysis. Devices that store time-stamped records facilitate trend analysis and correlation with activities or external conditions. Some units provide simple indices or color-coded ranges to help interpret fluctuations, while others export raw values for statistical evaluation. When evaluating time series, analysts often account for short-term spikes versus sustained elevated levels; short spikes may reflect transient events, whereas persistent elevations can indicate underlying ventilation or source issues. The next sections examine practical components and considerations in more detail.