Cash-Out Refinance Calculator: Estimating Potential Loan Amounts And Equity Access
Interpreting Scenario Outputs and Comparing Cash-Out Refinance Estimates
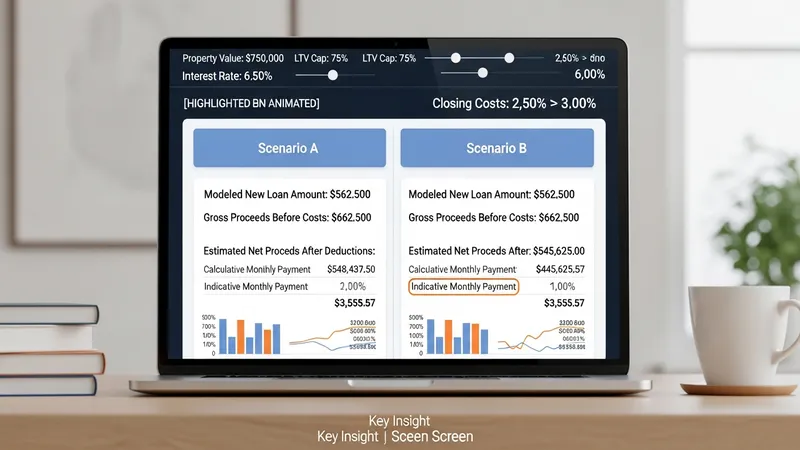
Calculated outputs typically include the modeled new loan amount, gross proceeds before costs, estimated net proceeds after selected deductions, and an indicative monthly payment. Some tools also report modeled total interest over the loan’s life or provide an amortization table. When comparing scenarios, observe consistent inclusion or exclusion of cost categories so comparisons are like-for-like. For example, comparing two scenarios where one deducts closing costs and the other does not can mislead assessments of available proceeds; consistent treatment ensures clearer interpretation of trade-offs among rate, term, and proceeds assumptions.
Sensitivity analysis is a practical interpretive approach: vary one input at a time—property value, LTV cap, interest rate, or closing-cost estimate—and note how outputs shift. This helps identify which assumptions most strongly affect proceeds or payment in a given situation. Many users find that valuation and LTV assumptions produce the largest proportional changes in modeled proceeds, while reasonable rate variations more directly affect monthly payment estimates. Documenting assumed values alongside outputs enhances transparency and comparability across scenarios.
Non-monetary impacts merit consideration in modeled comparisons. Increasing leverage on a property can change future financing flexibility and risk exposure in hypothetical scenarios; refinancing may also change the loan’s term structure and amortization pace. While calculators quantify projected payments and proceeds, they cannot model every future outcome such as market shifts or individual credit changes. Treat scenario outputs as planning aids that highlight potential effects rather than definitive forecasts of future events.
When presenting or reviewing modeled results, maintain clear labels and avoid treating estimates as guaranteed. Note the assumptions for value source, LTV cap, included costs, and amortization structure alongside results. Sharing multiple scenarios that vary these assumptions tends to provide a more complete informational picture. Concluding the modeled analysis with a summary of key sensitivities helps synthesize findings while preserving the provisional nature of calculator outputs.