Business Intelligence Tool: An Overview Of Key Features And Capabilities
Data Visualization Capabilities in Australian Business Intelligence Solutions
Data visualization functions play a critical role in how BI tools present data to Australian users. Platforms like Power BI, Tableau, and Sisense typically include pre-built templates and custom visualization options to suit various business requirements. Commonly used charts in the Australian context include line graphs for trend analysis, bar charts for comparison, and geo-maps for location-based insights. Visualization tools may support interactive features such as drill-through, highlighting, and dynamic filtering to enable efficient data exploration.
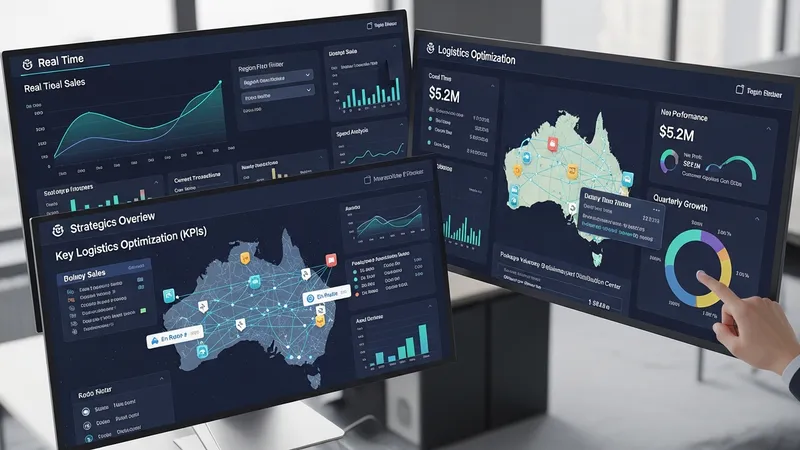
Color schemes, labels, and conditional formatting are adjustable within most visualization tools to match corporate branding or highlight specific data points. Interactive and real-time dashboards are beneficial in industries such as retail and logistics, where the latest sales numbers or supply chain performance must be monitored continuously. Visualization tools can also help Australian organizations identify discrepancies or outliers that may require corrective action or further investigation.
BI platforms typically allow users to export visualizations for use in presentations, reports, or communications with internal and external stakeholders. Data can often be shared as images, PDF files, or embedded within online portals. Advanced features may include automatic updates to reflect changes in the underlying data source. This automated approach to visualization management saves time and reduces manual reporting errors, enabling informed business discussions based on up-to-date metrics.
Privacy and accessibility are relevant considerations for Australian businesses when designing and sharing dashboards. Some BI platforms offer support for accessibility standards and permission-based access, ensuring sensitive data is visible only to authorized personnel. Additionally, mobile-friendly dashboards are increasingly prioritized, as many users in Australia require access to data visualizations via tablets or smartphones for remote work or on-site operations.